
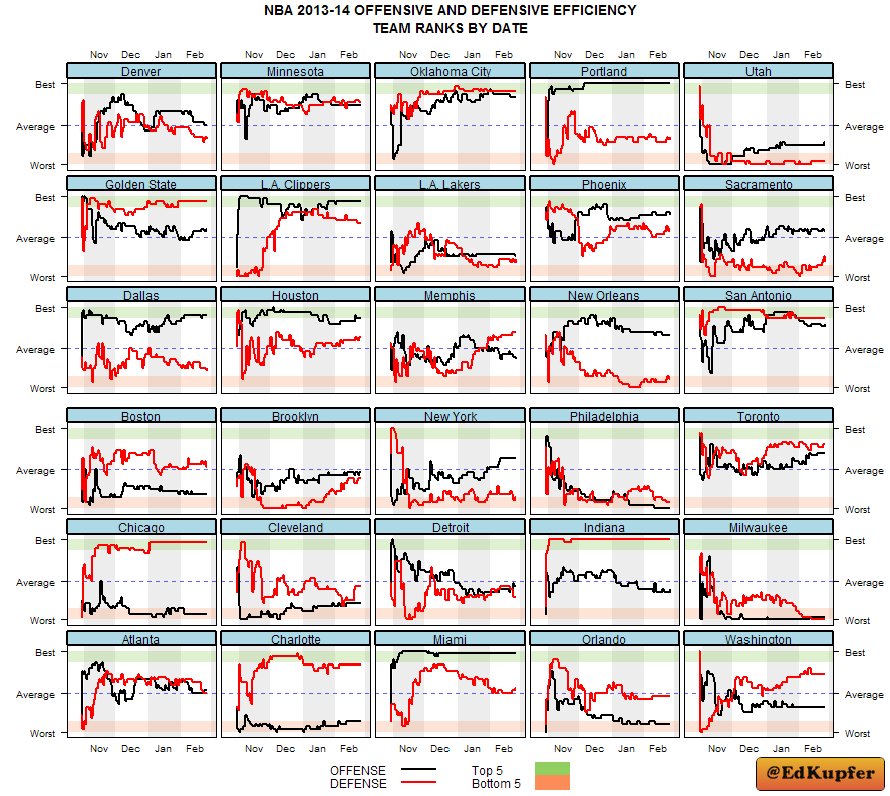

This chart, thanks to Houston Rockets analyst and occasional tweeted Ed Kupfer, shows how team’s offenses and defenses have changed over the course of the season. The black line notes where the team ranks offensively among all 30 teams by date, the red line notes defense. For example, the Portland Trail Blazers (first row, second from right) took a stronghold on the league’s best offense in December, and haven’t relinquished it since.
The Brooklyn Nets (fourth row, second from left) are an interesting case: their offense has remained basically the same all season, with a slight uptick in offensive efficiency in 2014. But their defense has gone from near-league-worst to middle of the pack in just a couple of months.
Through December 31st, the Nets allowed 106.7 points per 100 possessions, third-worst in the league. Since January 1st, they’ve allowed just 101.7 points per 100 possessions, a five-point improvement that ranks them eighth in the league in that time.
The timing’s not coincidental; right around the time Kevin Garnett moved to center, the team’s defensive efficiency improved drastically across the board. In the calendar year 2014, the Nets have allowed just 95.8 points per 100 possessions with Garnett on the floor, which would rank as the second-best defense in the league behind the Indiana Pacers — who, as you can tell from the chart above (fifth row, second from right) have been atop that chart for most of the season.