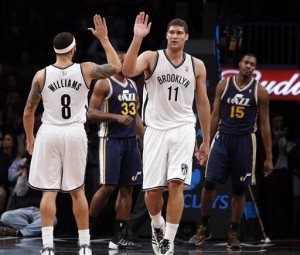
It’s been a tale of two seasons for the Nets, who turned a 10-21 record at the end of the calendar year into a playoff spot.
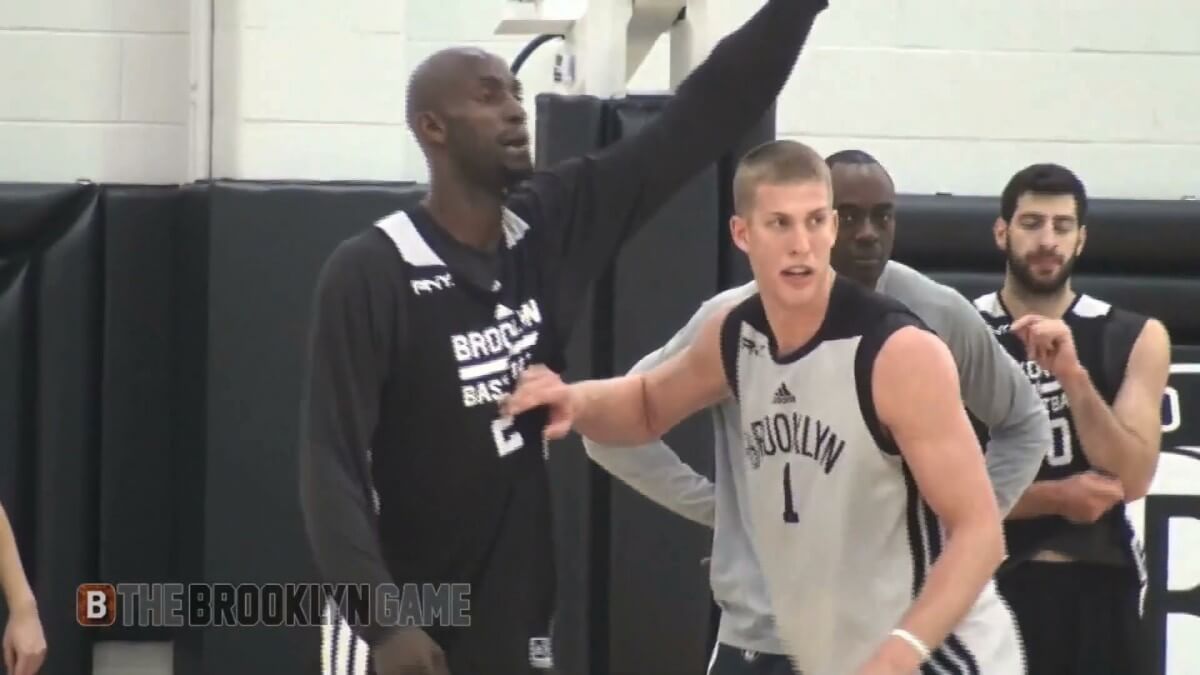
In the video for YES Network above, I discuss the reasons why the Nets have turned it around in 2014, including the emergence of Shaun Livingston in their longball lineup, the team’s newfound turnover creation (2.7% more possessions) and three-point shooting (5.7 more attempts per game), and Kevin Garnett’s impact in the paint.
For some more on how much better the team’s gotten in 2014 than 2013, check out the chart below. Third season starts Saturday,
| 2013 | Brooklyn Nets | 2014 |
| 10-21 (.323) | Record | 34-17 (.666) (+.343) |
| 96.8 | Points Per Game | 99.6 (+2.8) |
| 101.4 | Points Allowed Per Game | 96.8 (-4.6) |
| 3 | Longest Winning Streak | 5 (+2) |
| 5 | Longest Losing Streak | 3 (-2) |
| 94.6 | Possessions Per Game | 93.1 (-1.5) |
| 101.9 | Points Per 100 Possessions | 105.0 (+4.0) |
| 106.7 | Points Allowed Per 100 Possessions | 103.9 (-2.8) |
| -4.8 | Net Rating | +2.0 (+6.8) |
| 49.1% | Effective Field Goal Percentage | 52.8% (3.7%) |
| 37.2% | Three-Point Percentage | 36.8% (-0.4%) |
| 19.9 | Three-Point Attempts Per Game | 25.6 (+5.7) |
| 75.9% | Free Throw Percentage | 75.0% (-0.9%) |
| 25.9 | Free Throw Attempts Per Game | 23.5 (-2.4) |
| 51.1% | Opponent Effective Field Goal Percentage | 50.7% (-0.4%) |
| 39.1% | Opponent Three-Point Percentage | 35.3% (-3.8%) |
| 23.0% | Offensive Rebounding Percentage | 21.0% (-2%) |
| 73.4% | Defensive Rebounding Percentage | 71.6% (-1.8%) |
| 48.1% | Total rebounding percentage | 46.4% (-1.7%) |
| 6.9 | Steals Per Game | 9.6 (+2.7) |
| 15.0% | Opponent Turnover Rate | 17.7% (+2.7%) |
| 16.5 | Points off Turnovers per Game | 19.8 (+3.3) |
| 451 | Minutes for Mason Plumlee | 824 (+373) |
| -3.5 | Kevin Garnett’s Plus-Minus | +5.0 (+8.5) |
| 33.8 | Points Allowed In Paint, Garnett On Floor | 31.8 (-2.0) |
| 44.3 | Points Allowed In Paint, Garnett Off Floor | 43.5 (-0.8) |
| 9 | Shaun Livingston Starts | 45 (+36) |
| 43 | Shared Minutes, Deron Williams/Shaun Livingston | 699 (+656) |
| 29 (*estimate) | Number of ties worn by Jason Kidd | 0 (-29) |