

Say you recently won a charity auction that afforded mindless malcontents like you the opportunity to play in one NBA game. You’re excited, you’re all warmed up, you’ve just high-fived your favorite NBA players, the ball gets tipped, and the game begins!
And then they ruthlessly tear you to shreds. With a useless slop pile like you at small forward, the team never has a chance to run a decent offense. You never even touch the ball. Your coach, who has a macabre sense of humor, decides to watch you flail around for 48 minutes for his own amusement. Finally, with the clock winding down and you calculating in your brain how you could possibly turn this into a lawsuit, the teams finally relent and allow you a couple of open layups to make it worth your while and help you avoid a record 48 trillion.
The next day, you decide to check your stats while you’re sitting in traction at the hospital. On the essential Basketball-Reference, your offensive rating is through the roof — probably like 175 or something. But on NBA.com, your offensive rating is way worse, probably less than half that. How is that possible?
Because they’re two totally different numbers. Even though they’re both named the same thing, “offensive rating” can have two very different meanings depending on who’s providing the number.
NBA.com’s offensive rating is a reflection of how many points your team scored per 100 possessions when you were on the court. That’s it. If you play 100 possessions and your team scored 95 points, your NBA.com offensive rating is 95. It doesn’t matter if you scored all 95 of those points or you hid in the corner for 100 possessions.
But Basketball-Reference’s offensive rating is a complex formula that estimates how many points you produce per 100 of your own possessions. That’s why your imaginary Basketball-Reference offensive rating was through the roof — you had two chances to score, and they were wide-open layups. Everything else that happened in the game — you getting bowled over and frozen out — wasn’t included.
It’s adapted from a book called Basketball on Paper by basketball analytics pioneer Dean Oliver, who has consulted for a couple of basketball teams and now works as the Vice President of Data Science for TruMedia Networks. I highly recommend it if you’re interested in the backbone of basketball analytics.
The defensive ratings are the same. Defensive rating, as used by NBA.com, is simply points allowed per 100 possessions by the team when you’re on the court. Basketball-Reference also uses a very complex formula to devise defensive rating, one that’s highly influenced by the team’s overall defense and box score statistics like turnovers, steals, blocks, and rebounds.
Because the two measure very different things, the numbers can end with wildly different conclusions. One way to think about it is how it’s reflective of a player’s role. For example: Tyson Chandler, Reggie Miller, and Jose Calderon all land in the top 15 all-time in Basketball-Reference’s offensive rating. That’s not because they are three of the 15 best offensive players of all time, but because they fit a high-efficiency, low-usage role that allowed them to thrive.
Chandler barely created any of his own offense, but more often than not, he’s on the receiving end of a pass that allows him to dunk the ball. Last I checked, dunks are good. Reggie Miller was one of the best three-point shooters ever, and because he worked off the ball, he rarely turned the ball over. Calderon has picked his spots throughout his career, and never taken on a big offensive load, which allows him to have a high Basketball-Reference offensive rating — lots of threes, few turnovers, and not a lot of high-risk plays.
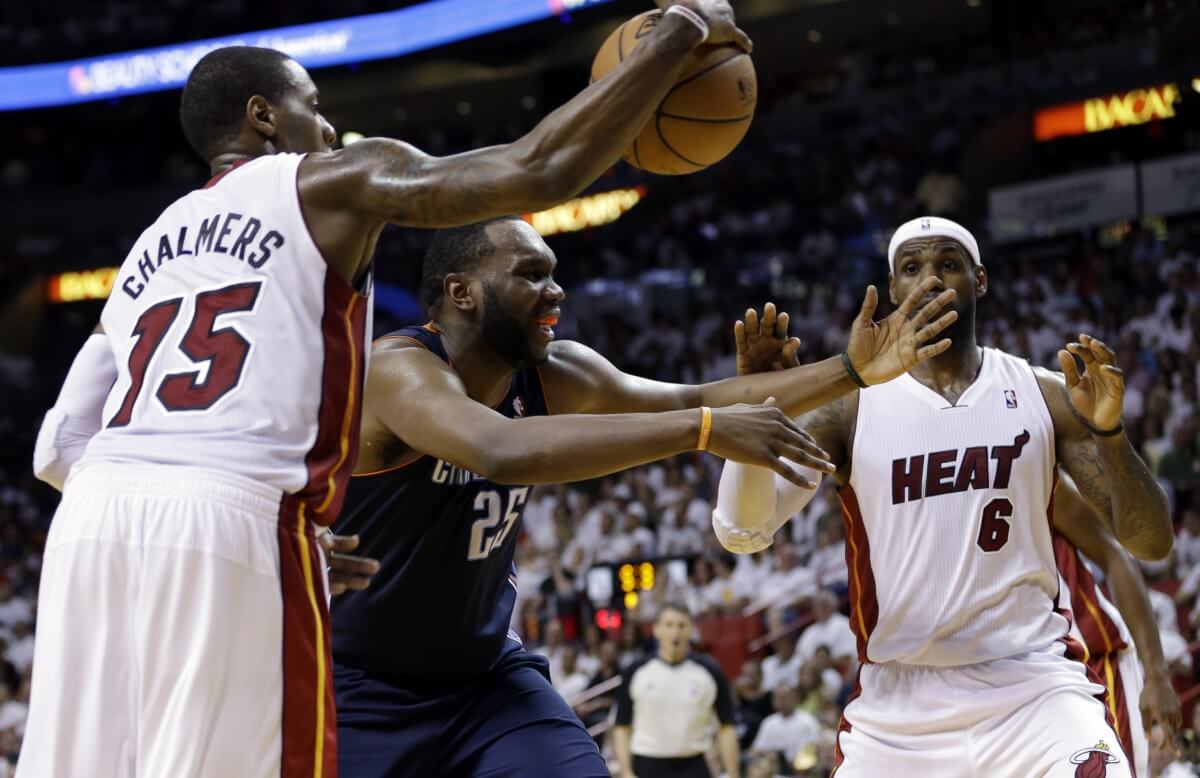
Here’s another example. One of the league’s best players by NBA.com’s offensive rating in 2013-14 was Mario Chalmers. The Heat produced 110.7 points per 100 possessions with Chalmers on the court, which would’ve ranked as the top offense in the NBA that season. But with all due respect to Mario Chalmers, Mario Chalmers isn’t one of the best offensive players in the league. He was just playing the majority of his minutes next to LeBron James, Dwyane Wade, and Chris Bosh, all of whom are pretty good at basketball.
That’s also reflected in the numbers the next year. With James in Cleveland and Bosh missing half the year, Chalmers’s robust NBA.com offensive rating fell to 99.7 points per 100 possessions, which would’ve ranked as the fifth-worst offense in the league.
So which is better?
This is a bit of an unfair question, because you’re measuring two different things. One measures your own performance in an imperfect way, the other measures your impact on the team in an imperfect way. It’s like choosing between black coffee and hot coffee with milk and sugar. It’s all a matter of preference.
(That’s a terrible example. Black coffee is clearly better.)
It’s all fit and context. Chalmers isn’t a great or terrible NBA player. He just happened to know and fit his role with the LeBron-led Heat as a floor spacer and lighting rod for people yelling at him. He couldn’t do that as well with the new team, and the team wasn’t as good overall, so the number fell. Any NBA offense with Tyson Chandler is going to fail if you rely on him as a primary offensive creator, rather than a runner and dunker. (Message to Tyson Chandler: if I ever win that charity auction, please don’t kill me with a dunk.)

If a wing player plays the majority of his minutes with a top-flight interior defender, you have to account for that in his NBA.com defensive rating. If a big man is a high-flying dunker that’s playing with guards that can’t get him the ball in a position to score, or in an offense that’s not tailored to his skills, his Basketball-Reference offensive rating will suffer. Basically: I’m a nerd telling you to watch the games.
But when you do use them, hopefully now you know a little more about what they measure.