
The Brooklyn Nets are one of many NBA teams that have put a premium on motion this preseason, preaching a new flex offense based on constant player and ball movement to create open shots.
But is it worth it? NBA.com’s John Schuhmann had a different take, studying the correlation between ball movement, player movement, and offensive efficiency. After looking through the numbers, he ultimately concludes that “There is no correlation between ball movement and offensive efficiency,” and “the same goes with player movement.”
In some sense, he’s right. Just moving the ball or the man doesn’t necessarily mean that man’s in any better position to score, and sometimes more passes can actually be bad for an offense: After all, you’ve only got 24 seconds to score. But that begs a question: what does actually correlate to a successful offense?
To figure out just what correlates to winning — and what doesn’t — I took a few numbers from the NBA’s public-facing SportVU database, adjusted them for pace, and checked how strong they correlated to NBA offensive rating, or points scored per 100 possessions. I then scaled the ratings between -100 and 100: 100 is a perfect correlation, -100 is a perfectly negative correlation, and 0 is perfectly random. Strong correlations usually run upwards of 50, moderate ones from 30-50, and weak ones between 0-25.
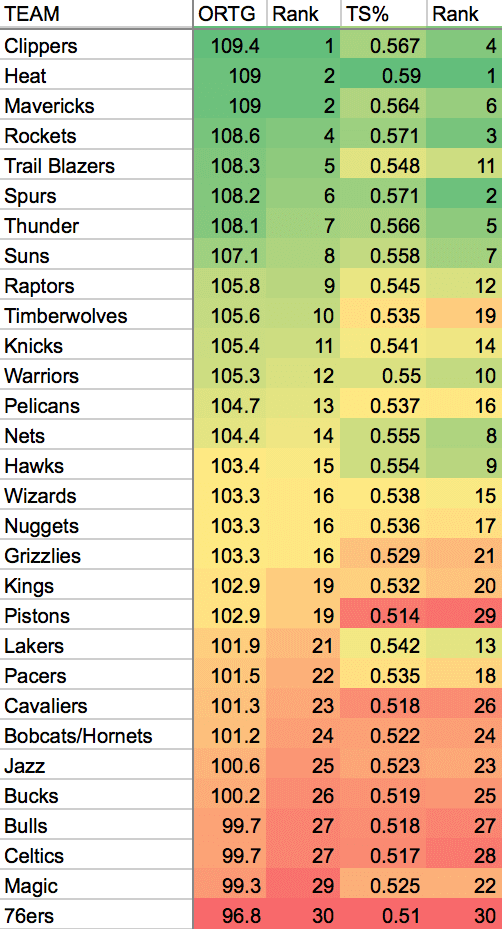
One obvious conclusion to get out of the way: shooting well means you have a good offense. The strongest correlations to offensive production were true shooting percentage (88.5) and effective field goal percentage (84.4), the latter accounting for three-pointers and the former adding in free throws.
If you shoot well, you’d have to be terrible at everything else on the offensive end to have a below-average offense. One example was the Los Angeles Lakers, who had an average effective field goal percentage but were the worst offensive rebounding team in the league, bringing their offense down to 21st in the NBA.
But what shots are the good ones? What non-shooting traits matter most? Here’s the biggest takeaways from what I found, with the correlation number in parenthesis:
Strong Correlation
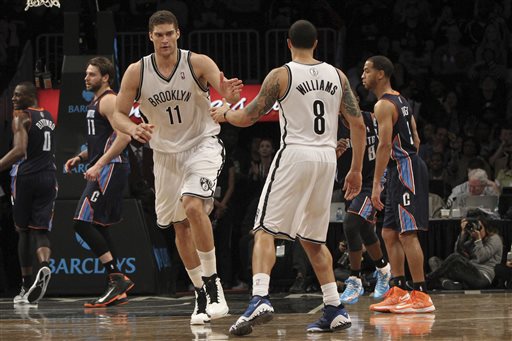
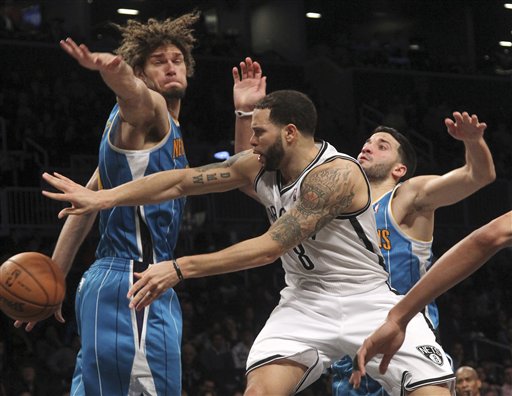
- How well your offense can drive & kick. While the pure number of drives to the basket (6.3) showed no correlation to offensive efficiency, what teams ended up doing with those drives did. Field goal percentage on drives (66.1), as well as team points created per drive (62.5) were both strong indicators of a good offense. If Deron Williams comes back as healthy as advertised, Brooklyn’s success on offense will probably hinge on how much he’s trying to get to the basket and set up teammates for open shots.
- Converting close looks. Every team needs a player that can hit the bunnies and tough shots in the post, and field goal percentage on “close” looks — defined as any touch that started within 12 feet of the basket and ended in a shot — was almost as important (62.8) as how well teams drove to the basket. The Heat, Mavericks, Thunder, and Clippers, four of the league’s top seven offenses, also finished in the top seven of the league in close field goal percentage.
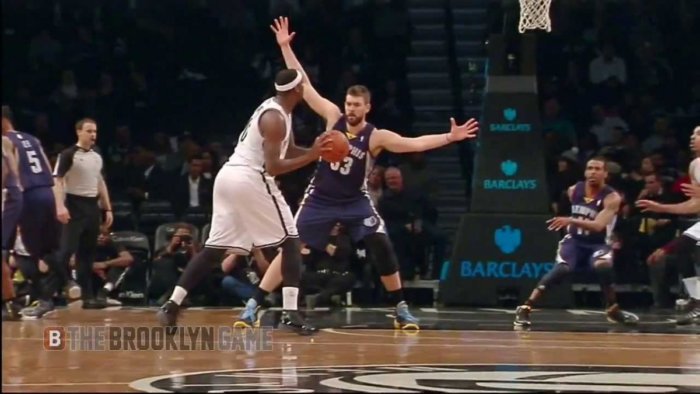
Interesting enough, there didn’t seem to be any correlation between the number of close attempts a team had and good their offense was — if anything, it was slightly negative (-29). Could be random, but one theory: some of the worst teams in the league at converting close touches relied heavily on post-up scorers, like the Sacramento Kings (DeMarcus Cousins), Chicago Bulls (Carlos Boozer), and Memphis Grizzlies (Zach Randolph, Marc Gasol). Conversely, some of the best relied on their big men to act as finishers, like the Clippers (Blake Griffin, DeAndre Jordan), Dallas Mavericks (Brandan Wright), and Oklahoma City Thunder (Serge Ibaka). Lends credence to the idea that the NBA’s slowly moving away from one-on-one post play, and suggests that Brook Lopez has to be very, very good to lead the Nets as a first option.
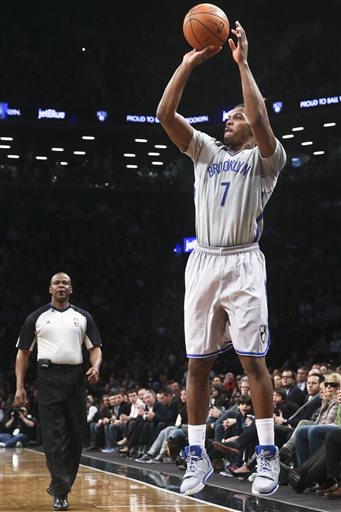
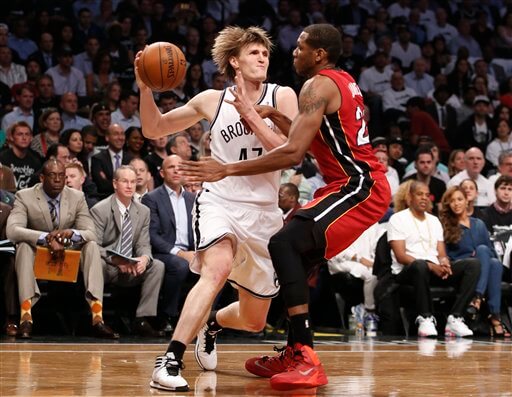
AP - How well you catch and shoot — especially from deep. The pure number of catch-and-shoot attempts per game (3.7) had no correlation with good and bad offenses, but catch-and-shoot three-point attempts per game (44.5) did, and three-point percentage on catch-and-shoot attempts (53.3) was even stronger.
Williams and Joe Johnson were the two team leaders in effective field goal percentage on catch-and-shoot attempts last year, and it’s no coincidence that of the nine two-man combos that the Nets ran out for at least 800 minutes last year, the Williams-Johnson combo was the best offensively, scoring 108.8 points per 100 possessions. When those two play off each other, you’ve got two guys who can both drive to the basket and hit open threes, and both should flourish if Williams comes back fully healthy.
Moderate Correlation
- Getting to the line. YGTMYFT. (33.1)
- Limiting turnovers. Even if one of the other tenets of point guard play doesn’t mean much (more on that below), a team with a low turnover ratio (-29.9) usually meant a team with a productive offense.
No Correlation
- Offensive rebounding. Though long considered one of the “four factors” on offense, offensive rebounding percentage had close to zero (-2.2) correlation with offensive production in the NBA last season.
Only one of the NBA’s five best offensive teams ranked in the top half of the league at crashing the offensive glass — the Thunder, who ranked barely above average at 14th — and the league’s best team at offensive rebounding was the gargantuan, mercurial Pistons, who gobbled up 31.4 percent of their many missed shots en route to a bottom-12 offense.
One other note: offensive rebounding can be a defensive trade-off, in that some teams decide to send their players back on defense rather than crash the glass. The Boston Celtics in their championship-contending seasons were an example of this. Sure enough, there was some correlation between poor offensive rebounding and good fast break defense, as long as you discounted the Lakers, who were somehow the worst in the NBA at both.
The Nets were one of the worst-rebounding teams in the league last season and project to be even worse this year, so they might find comfort in knowing that it wasn’t nearly as important to control the offensive glass as other factors. But that’s not going to mean much if they’re just fighting for rebounds and failing, then giving up transition points on the other end.
- Assist ratio. This is a surprising one, but the ratio between points created by assists and points actually had a minimally negative correlation (-6.8) to offensive rating. It seems to run counter to basketball wisdom that ball movement makes an offense good, but three of the top eight offenses ranked in the bottom 10 of the percentage of their points created by an assist, and three of the worst seven offenses ranked among the best.
More than anything else, a team needs scorers; it doesn’t matter what offense you run if you don’t have players that can finish the play. If you pass the ball around in a well-run offense, you get an open look a la the Spurs. If you throw it around until someone takes a bad shot, you get the Bucks.
Final thoughts
The NBA has evolved drastically in the past decade. Point guards are no longer just set-up men for scorers, they’re athletic freaks that can cause havoc by attacking the rim. The three-pointer is no longer considered a passing fad, no matter what Byron Scott says: it’s a staple of a successful team. NBA defenses have copied Tom Thibodeau’s system to pack the paint and close out on the corners, limiting the most successful real estate on the floor. The numbers, even with just one season’s worth of data, reflect that coaches and teams have figured out what’s working.
That’s not to say that offensive rebounds are inherently bad. An offensive rebound by its very definition is good: it extends the possession, giving you a second chance at scoring. An assist is good: it means your team scored. Good ball movement and good player movement may not show up in the SportVU data, but any coach worth his salt will tell you a successful backdoor cut beats a contested isolation shot any day. Nobody will — nor should — coach against these things, and correlation doesn’t necessarily mean causation. With all that said, from these numbers we can glean the importance of certain factors over others, and it’s possible that some things — like offensive rebounds or points from assists — just aren’t as important as we thought.