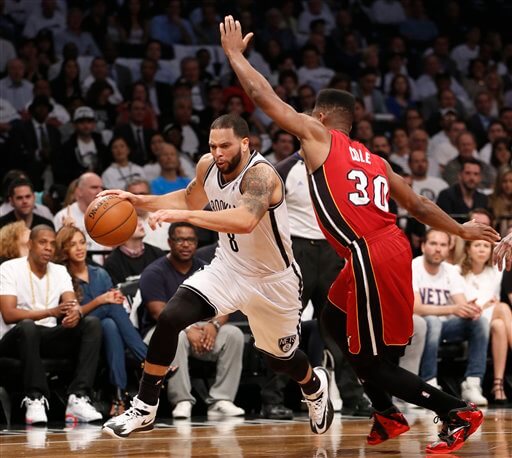
How fast is Deron Williams?
It’s a simple question that used to be impossible to answer definitively. But now, thanks to NBA.com’s newly public optical tracking data, we can learn not just how fast Deron Williams ran, we can also figure out how his speed evolved over the course of last season.
Let’s start with this:
Deron Williams
Here’s how you use these charts: the blue line (the one wildly going up and down like an EKG) is Deron Williams’s average speed in each game he played. The orange line is a dynamic average of Deron Williams’s average speed throughout the season, up until that point in the year. The blue line at the very bottom is the same as the orange line, but it allows you to zoom in on a specific section of the season (like January, when Deron underwent PRP treatment and cortisone shots to lessen inflammation).
Williams started slow, and ended slower. Of the 50 qualifying point guards (minimum 41 games, 20 minutes per game), Williams finished 34th in average speed. He dove from a season high of 4.2 miles per hour in the middle of December down to 4.09 by the end of the season.
This tells us a few things about Deron’s year. It doesn’t mean he “broke down,” but we now have some empirical evidence that he slowed down over the course of the year. That’s probably due to a few factors: bodies get fatigued over the course of an 82-game season, Williams hasn’t been very good at speeding into the paint on pick-and-rolls, and he’s had more ankle problems than any All-Star in recent memory.
It’s also worth noting that other than January, when he was recovering from treatment, Williams was at his slowest in the playoffs. The game naturally slows down during the playoffs already, so that’s no surprise. But if you’re a cynic, you could say it’s more evidence that his body needed rest more than more games.
The NBA doesn’t publicize the maximum speed of their players — it’s not something they want out there. So this takes into account stopping, screening, cutting, jogging, sliding, flopping, and in-game referee abuse. That’s why Deron Williams can have the same average speed as Russell Westbrook, despite the fact that Russell Westbrook was carved from the dreams of our athletic ancestors.
Average speed is also reliant on a team’s system. The San Antonio Spurs run a series of zippers and counters that rely on constant motion from point guard Tony Parker, which inflates his average speed.
But a system like that only works when you have a well-conditioned athlete like Parker, and he’s a freak: after a dip in January, Parker got faster and faster as the year progressed, hitting his crescendo during San Antonio’s title run. His average speed actually increased slightly in the playoffs (4.5 to 4.6 miles per hour), and the chart below shows he hit the playoffs, erm, running.
Tony Parker
Here’s how fast he was: if Parker vowed to spend the beginning of the season catching up on French literature and didn’t move a muscle until he finished Madame Bovary, he could’ve spend eight full games reading and sipping red wine at center court and still had a faster average season speed than Deron Williams.
But comparing anyone to Parker’s going to make them look bad: he’s an anomaly playing in the NBA’s best system. Here’s a comparison to a similar player, Memphis Grizzlies point guard Mike Conley. Conley was the starting point on one of the only teams slower in pace than the Nets this season, and also a disciple of new Nets coach Lionel Hollins.
Mike Conley
Conley had a similar downtick in speed to Williams, but was a bit more consistent: If you take out his first few speedy weeks, his average speed from December to the end of the playoffs only dipped from 4.2 to 4.15 miles per hour. Williams’s decline was a bit more drastic.
For argument’s sake, here’s the Phoenix Suns’ Goran Dragic. Dragic played in a slightly faster system and was on a team fighting for a playoff spot until the last day. He didn’t really slow down over the course of his breakout season, leveling out just above 4.3 miles per hour.
Goran Dragic
This is only the first year of the NBA’s optical tracking data in all 30 arenas, so there’s an enormous amount of data to parse that might just end up being noise. But a cursory look at average speed helps build the case that Williams just wasn’t healthy at all last season.
That could mean one of two things. The bad: he’s on the downswing of his career and his conditioning isn’t coming back. The good: two ankle surgeries this offseason may have fixed that problem.
We’ll see come October. What do you think?


