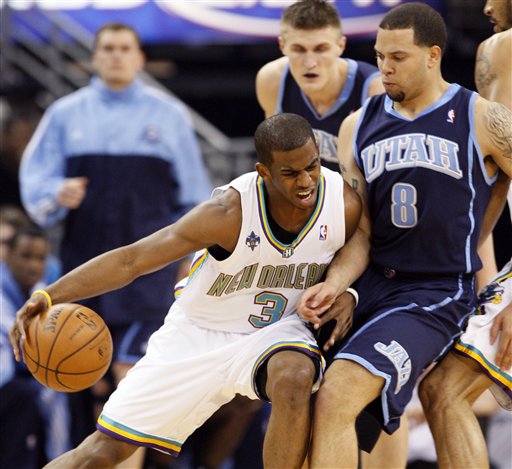


Here’s a scenario: you need one player to hit one shot, and you’ve got two choices. On your left, Chris Paul. On your right, Sundiata Gaines.
Who ya got?
Anyone in their right mind (or not watching Gaines’s first professional game) takes Paul without a second thought. His additional otherworldly abilities aside, Paul’s simply a better scorer: his effective field goal percentage (weighted for three-pointers) in 2011-12 was a strong .522, while Gaines’s was .428, well below average. No mystery there: CP3 is just better.
Now, what if I told you that one Brooklyn Nets starter’s efficiency last season swung from Gainesian to Paulian, solely depending on which side of the floor they were shooting on?
Furthermore, what if I told you the combined efficiency of the entire starting five swung on the same principle: on one side, they were as efficient as David Lee, but on the other, worse than DeShawn Stevenson?
It’s true — and we know thanks to a little-known tool known as VORPed.
Earlier this week, ESPN scribe Tom Haberstroh introduced a new website to the Twitter community called VORPed, which puts together unique player shot charts to both figure out player hot zones as well as show a detailed list of misses and makes all over the floor. The site’s got some great data visualizations as well as the shot charts, so I do suggest you check it out.
These charts, when applied to the Brooklyn Nets, give us insight into a few important team-related shooting strategies: where players like to shoot, where they’re effective from, and how to best spread & open up the floor to get players into their sweet spots. (One caveat: the data only goes back two years.)
Taking a look at the Nets’ projected starters:
The holdovers
Deron Williams (2010-11, 2011-12)


Sweet spots: Right side (non-corner three), center (midrange & in)
Weak spots: Top-of-the-key threes, left side
What this tells us: Williams has been a pretty centrist shooter, finding many of his most successful attempts from head-on jumpers, but shot just 12-67 (17.9%) on straight-on three-pointers in this past season. He also shaded more to his right in 2011-12, and to begin a pattern you’ll see often, shot far better doing so: Williams averaged a little over a point per shot from the right side (not including corner threes), as opposed to just 0.77 points from the left.
Gerald Wallace (2010-11, 2011-12)


Sweet spots: The rim, right-center midrange
Weak spots: beyond the arc, left side midrange
What this tells us: Wallace became much more rim-oriented in 2011-12, and for good reason: outside of some success shooting from the midrange center and right, his jump shot was quite ineffective. He did shoot well from the left corner three (36.8%), but shot under 26% from the remaining zones on the left side of the floor. If his issues shooting persist, Wallace will likely not see too many sets run for him, instead relying on cuts to the basket and offensive rebounds to get quick points at the rim.
Kris Humphries (2010-11, 2011-12)


Sweet spots: Left wing midrange, right corner midrange, dead-on
Weak spots: Left corner midrange
What this tells us: Humphries graded out far better as a midrange shooter than I’d anticipated, shooting a scorching 59.5% from the left wing in the last two seasons. Small sample size alert, though: he’s only attempted 42 shots there. If Humphries continues to shoot well from that wing, they’ll need him there often, as every other starter is a right-side heavy scorer. Humphries also shot well from the right corner, shooting 42-95 (44.2%) in the two years combined. Like Williams, Humphries’s chart has a trail of made shots directly in front of the rim leading out to 18 feet.
The replacements
Shelden Williams (2011-12), Brook Lopez (2010-11)


What the Brooklyn Nets lose: Nothing, really.
What the Brooklyn Nets gain: In the paint, shading right, both midrange corners
Weak spots: Left-center midrange
What this tells us: Williams was completely ineffective anywhere that he wasn’t within reaching distance of the rim, hitting just eight shots outside of dunks and layups all season. I don’t need to spend much space explaining that Lopez is an upgrade there.
Lopez has an interesting effectiveness triangle — beginning in the short left corner, extending upwards to roughly the foul line, then extending outwards all the way to the deep right corner. In the areas the triangle mostly encompasses, Lopez shot an excellent 53% from the floor; outside of those areas, he shot only 36.4%. If Humphries can continue to be a threat from the left elbow, that’ll open up the floor that much more for Lopez to exploit these strong points.
Anthony Morrow, DeShawn Stevenson (2011-12)


Joe Johnson (2011-12)

What the Brooklyn Nets lose: Left corner midrange & 3, left wing midrange
What the Brooklyn Nets gain: Stronghold over entire right side & center
Weak spots: Left side (midrange)
What this tells us: Remember our introductory hypothetical, and chew on this: Discounting shots at the rim, Johnson’s eFG% in 2011-12 from the left side (including threes) was .428, exactly matching Sundiata Gaines’s. His eFG% from the center and right side of the floor? .528, slightly better than Chris Paul’s .522. That’s right: the difference between Joe Johnson the left-side shooter and Joe Johnson the center-and-right side shooter is roughly the difference between efficiency magnate Chris Paul and efficiency dust mite Sundiata Gaines.
Should these results persist, the Nets will lose a slight amount of left-wing efficiency with Anthony Morrow’s departure, but it’ll be well offset by the good shooting Johnson brings to the table from the rest of the floor: he’s excellent at the rim and beyond it, as long as he’s center and east.
Spacing affecting the Brooklyn Nets
The Brooklyn Nets have an awful lot of talent in their starting lineup, and just by playing together, their efficiency should improve across the board. But part of maximizing that efficiency is knowing where players shoot best, and the Nets have an awful lot of overlap in where they find their spots.
The big thing that pops out from these charts is how right-leaning the roster’s shooting touch is. Every starter but Kris Humphries displays a strong, dominant lean towards shooting (and shooting well) on the right side of the floor, and a significant drop-off on the left side. In the aggregate last season (2010-11 for the injured Lopez), the new Brooklyn Nets starting five produced an effective field goal percentage of 50.3% on the right side of the floor, and a measly 40.1% from the left. Efficiency-wise, that’s the difference between David Lee and Ben Wallace. And yes, on the right, they’re even worse than DeShawn Stevenson (40.4%).
That’s not to say that the Nets can’t use that right side well. They can. Lopez’s efficiency from the right mostly comes from creating off the block and midrange corner jumpers, a unique skill in the starting five. Williams is best from the right wing, midrange and out. Wallace is most likely best suited to attack the rim and hang in the corner, and Johnson is so good from everywhere that he can fill in wherever there’s open space. As mentioned, having talented players helps a lot.
Hopefully, that talent translates to improved shooting from all over the floor.