 I’ll admit I was once a non-believer. A little less than a decade ago after reading Michael Lewis’ Moneyball and watching the 2003 Boston Red Sox –- with noted statistician Bill James as part of their front office team -– collapse in the playoffs against the New York Yankees, I questioned why there was a contingent of people who follow baseball that were so insistent on moving away from the traditional models we used to judge quality. What was wrong with home runs, RBIs and batting average as the be-all, end-all metric? Don’t even get me started on basketball. How was it possible to take a team game like basketball and develop new metrics to determine who’s better than who?
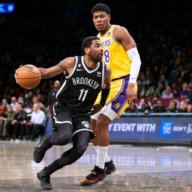
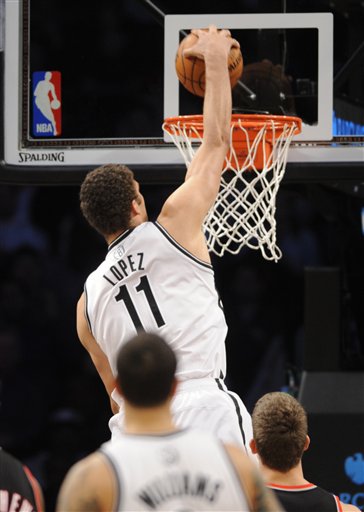
But I’ve since seen the light, and I firmly believe if others did, rather than focusing on antiquated criteria like points or rebounds per game, or silly perceived intangibles like past reputation, Brook Lopez would have been named an All-Star last night.
Brook Lopez’s omission is not only a slight against the player and the Brooklyn Nets organization –- who apparently inadvertently blacklisted their players by firing coach Avery Johnson last month if you’re to believe some of the talking heads on television -– but also a slight against math and numbers itself. I shouldn’t be surprised. Math constantly comes under attack, especially when it tells people things they don’t want to believe. Just ask Nate Silver.
It doesn’t change the fact that despite all of the Frank Isola’s of the media world who think we still live in an era where frumpy sportswriters (think Oscar Madison) slave over their typewriters with coffee stains on their shirt, that not only is there truth in the advanced metrics being used to admonish Lopez’s snub, there’s reality to it.
Of course, the statistic that is most quoted in defense of Lopez is his Player Efficiency Rating, or PER. For the uninitiated, PER is hardly a perfect stat, but it’s certainly a very good one, and an effective way to compare players, primarily on the offensive end, using a consistent mean.
The PER stat is born out of the fact that in this era of advanced technology and scouting, there are better ways to judge a player’s performance than just the traditional metrics of points per game, rebounds per game and field goal percentage. Just like in baseball, the traditional stats don’t tell the whole story. A player may hit a lot of home runs, but that’s because he plays in a hitter-friendly ballpark. He may drive in over 100 RBIs, but that could be the byproduct of the high-octane line-up he plays in. A pitcher might have a low ERA, but if it’s not supported by high strikeout and low walk rates, there could be other fluky factors in play that will indicate an imminent regression.
In basketball, we can’t hold hallow numbers like Wilt Chamberlin’s 100-point game, or Oscar Robertson’s triple double season without understanding the range of mathematical factors at play –- primarily pace, or the number of possessions each team gets over the course of the game. That’s why the numbers used to calculate PER are a more accurate picture of how the player performs offensively. It’s not just about points per game, but rather the number of possessions a player gets per game (usage rate) and how efficient he is with those possessions. What good is a 20 points scorer if it takes him 25 field goal attempts to do it (and is lousy at higher efficiency shots like free throws and three-point attempts, which are measured by true shooting percentage). And while we all love individual performances, since basketball is a team-oriented sport, what is the player doing to help create (or lose) offensive opportunities for his teammates (assist and turnover ratios)?
In other stats, people automatically think someone averaging double-digits in rebounds is great at crashing the glass, but rebounds per game doesn’t tell the whole story. Rebound percentage takes into account a number of things, including how a team may be playing a team that is having a particularly hot or cold night, thus producing less or more opportunities to rebound. So rather than counting the total number of boards a player grabs, it’s much more accurate to consider the percentage of available rebounds he snatches up in a given game.
Finally, what ties all these numbers together to calculate a player’s PER is his per minute production. While an ideal NBA superstar plays 35-40 minutes per game, there are a number of factors that sometimes inhibit playing time. In the case of Brook Lopez, his minutes are a bit more limited than some of his contemporaries selected for the all-star game because he’s still recovering from a foot injury, and his backup, Andray Blatche, is also having a phenomenally efficient offensive season.
So what the numbers ultimately tell us is that despite playing less than 30 minutes a game, Lopez is making the most of his possessions, averaging nearly 23 points per game per 36 minutes with a true shooting percentage of 56 percent and a turnover on only 9 percent of his possessions (which given his usage rate is very, very good). Additionally, despite being constantly critiqued for his rebounds per game in past seasons, his rebounding rate this year places him squarely in the middle of the pack for NBA centers this season. Meanwhile, Joakim Noah, an All-Star who’s constantly praised for his gritty defensive prowess and rebounding, only grabs 1.2 percent more of the available rebounds than Lopez. Chris Bosh, another All-Star, corrals 2.1 percent LESS of those misses.
If people want to continue to remain ignorant of these numbers and cling desperately to the old ways of doing things, I guess that’s their business, but as has been the case in baseball (and political polling while we’re at it), the groundswell for better statistical analysis is growing and is becoming a permanent part of the NBA. I would have never imagined 10 years ago that during the live broadcast of a baseball game on ESPN and Fox that someone would flash a player’s OPS on the screen, or play-by-play commentators would discuss a hitters batting average on balls in play, but I’ve seen that more and more in recent years. Nate Silver’s successful projection of the 2012 presidential race down to the percentage point in nearly every state, shows that there’s a reality in numbers. And my guess is at some point down the line, there will be collective recognition that despite the close-mindedness of a shrinking number of people in cities like New York, Miami and Chicago, Brook Lopez’s 2012-13 campaign will be revered as a fantastic season, by any measure.